
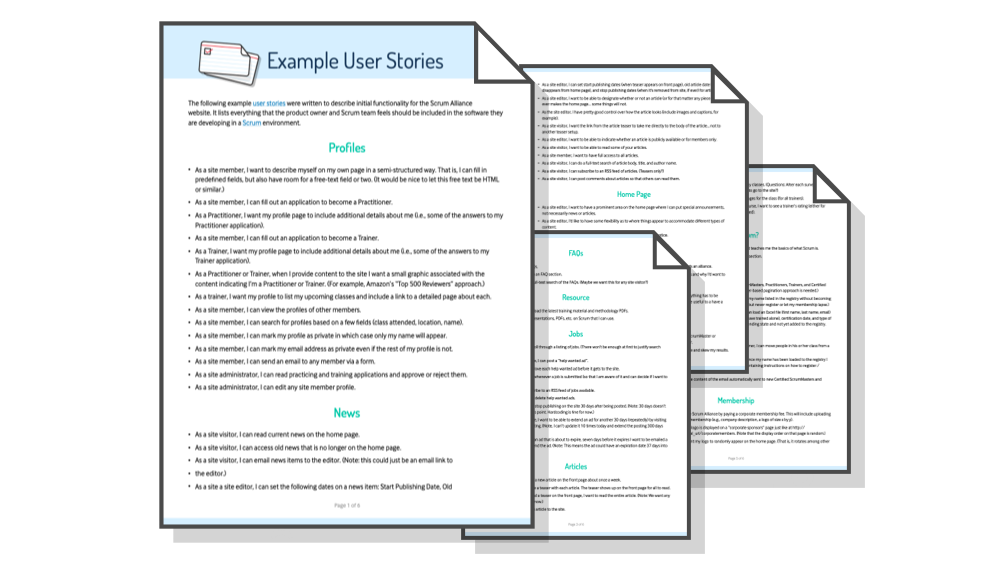
Get 200 Real Life User Stories
Examples Written by Mike Cohn
A story map is a two-dimensional visual representation of the things a user wants to do. (The idea for story maps in software development—and the name—comes from Jeff Patton.)
Story maps are a way to create a shared understanding of the product, to visualize user needs, and to elicit user story ideas during story-writing workshops. I tend to create them using sticky notes and paper on a big wall or, if we’re remote, on a virtual whiteboard.
Start with a Significant Objective
I recommend focusing story maps on a single, significant objective or MVP (minimum viable product). The MVP or objective should be chosen by the product owner in consultation with stakeholders.
A good significant objective is something that can be achieved in about three months. That period is long enough to make progress on big ideas yet short enough for progress to feel tangible.
Scrum teams can often use their product goal as their significant objective, as long as it was chosen to be about three months of work.
In some cases, a team may have a smaller significant objective and want to pursue more than one during a quarter. That’s fine, but create a story map for the first objective before moving on to a second.
Who Participates when Story Mapping?
I recommend creating a story map with the entire Scrum team present, including the product owner (to answer questions and to lay out the focus of the map in terms of a significant objective or MVP) and the Scrum Master (to facilitate).
You will also generally want to include stakeholders, customers, users, and others who can speak with authority about user needs.
The First Dimension: Across
The first dimension of a story map is a sequence of user tasks that is depicted horizontally across the map. The product owner leads participants through a discussion of the steps or actions a user will take to achieve a goal that is part or all of the significant objective.
A physical or virtual sticky note or index card is added to the map representing each step in the sequence. A meeting facilitator can write up all the cards if desired, but I find it more productive to let anyone write a new step on a card and then announce it as they add it to the map.
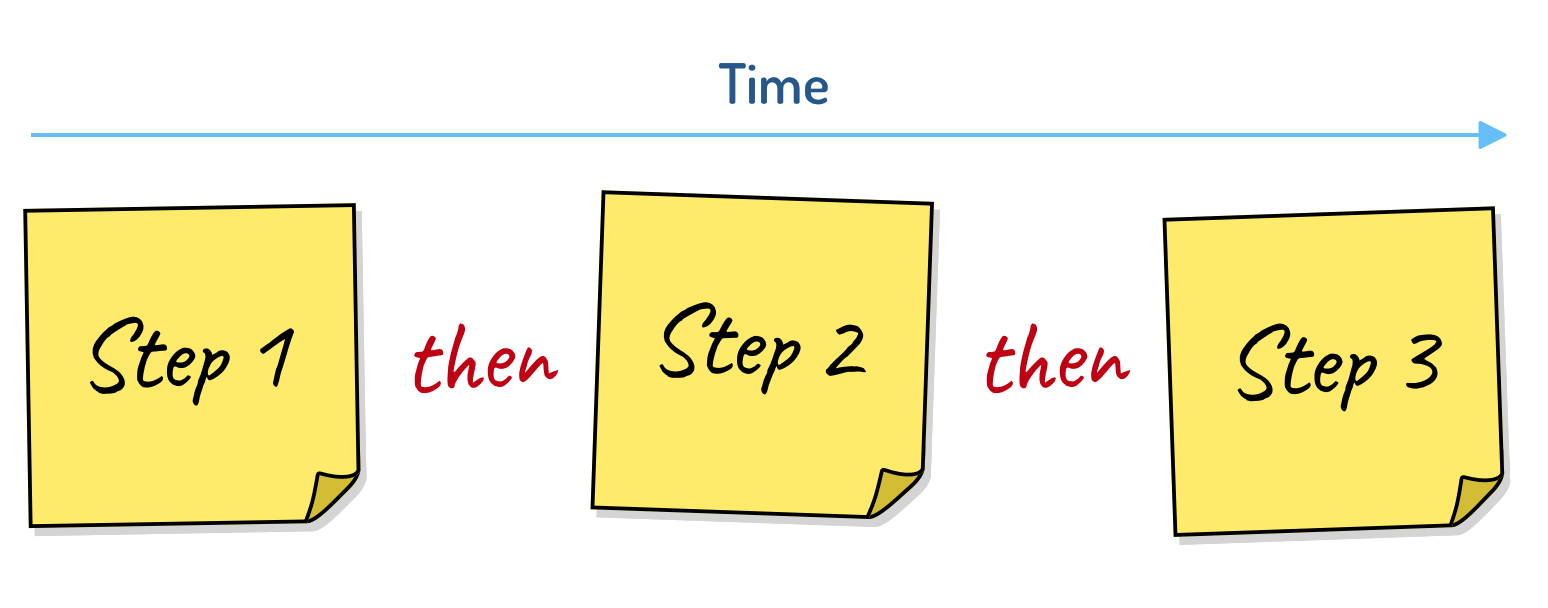
Figure 1: Cards are read horizontally by inserting the word then between each card.
Because the horizontal dimension of a story map represents a sequence, it can be read by inserting the word then between cards. So the map in Figure 1 is read as “a user does step one then step two then step three.”
For example, suppose you’re on a team that has been told to develop software that will allow company employees to submit expense reports and be reimbursed.
To submit an expense report, an employee first needs to log into the system. This becomes the first card in the map. Next the employee creates a new, blank expense report, which becomes the second card on the map—placed to the right of the log-in card to indicate that the two items occur in sequence.
This can be seen in Figure 2, which also shows that an employee next enters expenses and finally submits the expense report.
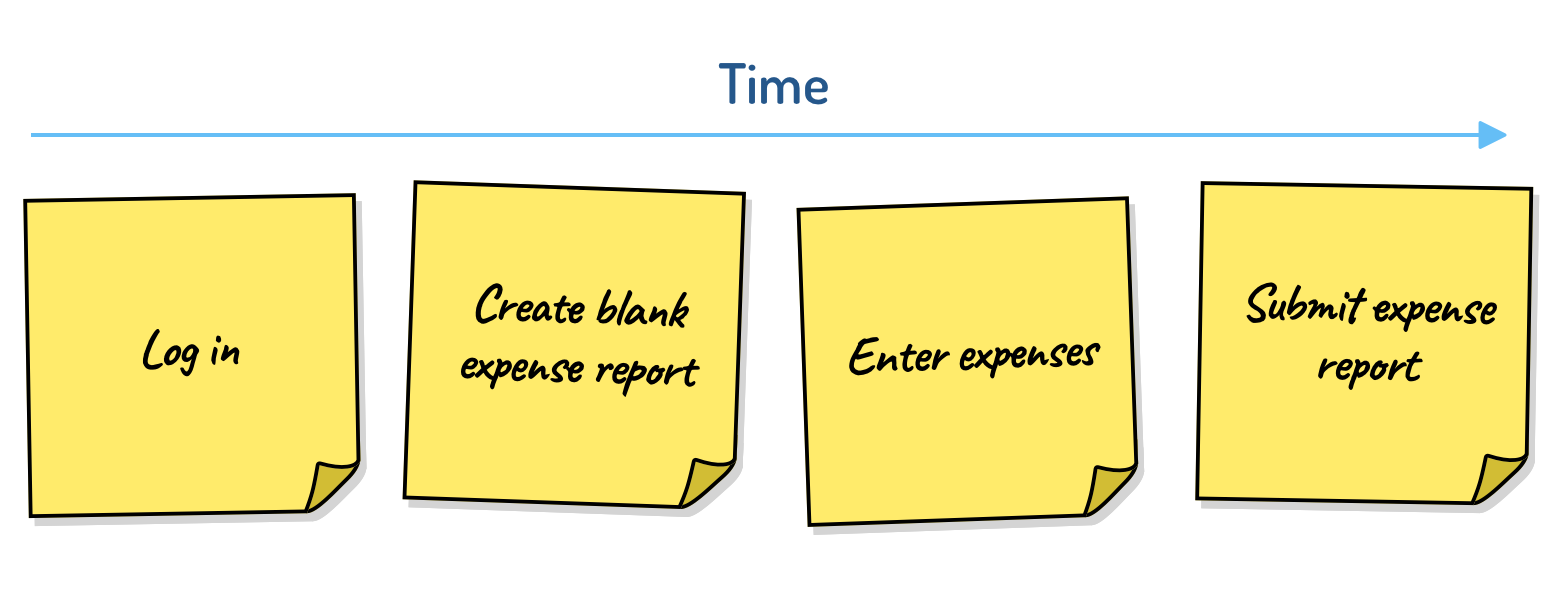
Figure 2: An initial story map for submitting expense reports.
To save time during the story-mapping process, the cards in a map are rarely written as complete user stories or job stories. Writing short three- or four-word phrases is better while mapping: you want the story map to be quickly created and quickly read.
After the meeting, the product owner or an analyst will often move items into the team’s product backlog management software (Jira, Trello, Monday.com, and so on) and create user stories using user story templates such as “As a …, I … so that….” or “When …, I want … so that….”
The Second Dimension: Down
Remember that earlier I told you a story map is two-dimensional. So what’s the second dimension? Alternatives.
Still using that expense-report example, let’s say meeting participants realize that some users could create a new expense by copying an old one. I do this quite often. Rather than starting with a blank expense report, I duplicate a recent one and edit the copy.
Duplicating an existing expense report can be added to the map under the option to create a blank expense report, as shown in Figure 3.
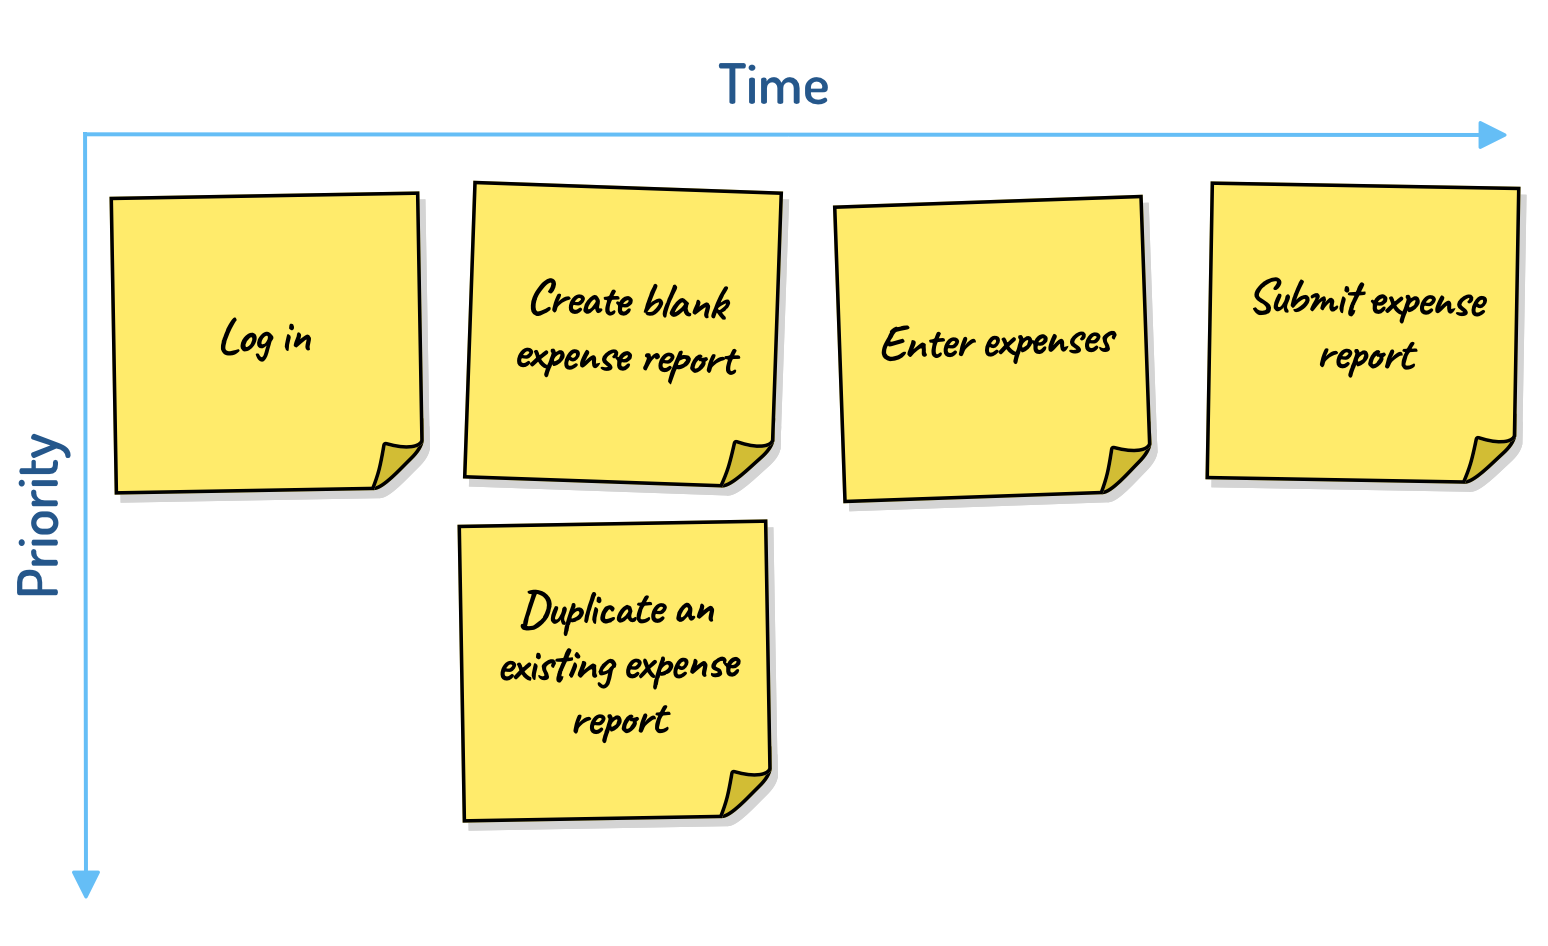
Figure 3. In addition to starting with a blank expense report, users may optionally duplicate an existing expense report.
Because the cards in a column are alternatives, the map is read by inserting the word or when reading down a column.
Now our map is read like this: A user logs in, then creates a blank expense report or duplicates an existing one, then enters expenses, and then submits the expense report.
Cards containing alternatives should be added to the map in descending order of priority—the most important at the top and the least important at the bottom. Priorities established like this in a story-mapping session aren’t rigid, and the product owner can change them. But it can be useful to have short discussions about rough priorities within a column of alternatives.
Getting Fancy: Add a Header Row
Some story maps can get extremely wide. When that happens, it can be helpful to add a row of headings to the map. For example, suppose a simple word processor allows users to format, print, and save documents. Those categories of actions could be added to a map as headings as shown by the blue cards in Figure 4.
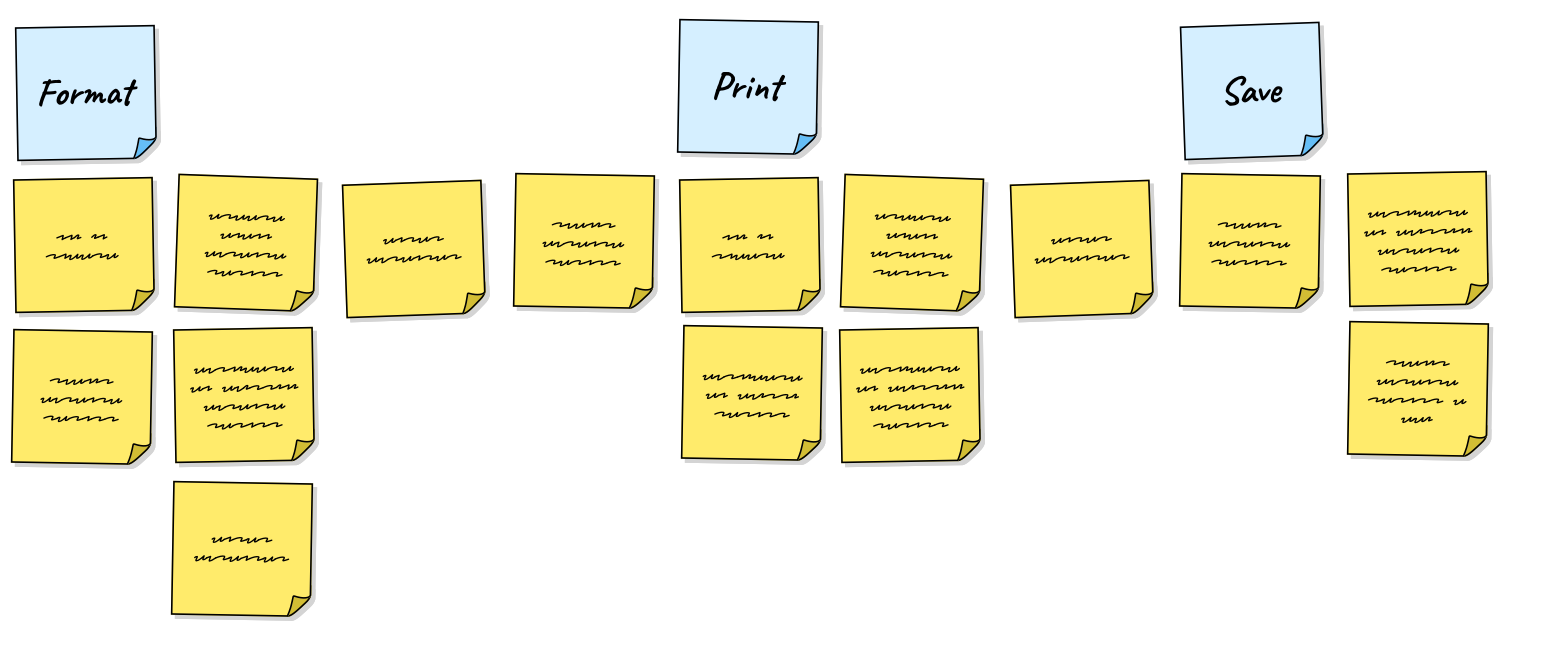
Figure 4. Blue heading cards have been added to indicate where portions of the map begin.
These heading cards can also be read with then between each: a user can format a document then print the document then save the document, in this case.
Heading cards are not themselves stories that will be implemented by the team directly, rather they are epics, themes, or whatever term your team uses to mean a group of related stories.
Getting Fancier: Use Submaps
I find wide maps difficult to follow even with heading rows. A better practice is to keep maps concise through the use of submaps. To do this, think of each card in a map as something you can metaphorically double click and expand into its own map.
Returning to the simple word processor that supported formatting, printing, and saving documents, we could create an extremely simple map with cards for only those three actions, as shown in Figure 5.
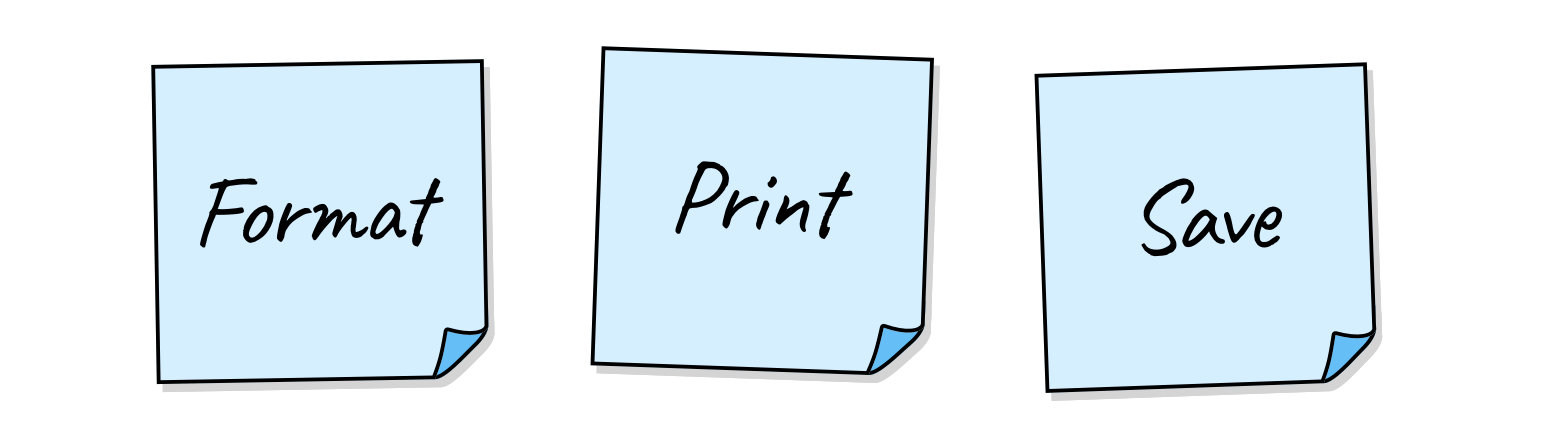
Figure 5. A high-level story map showing the three top-level actions in an extremely simple word processor.
Then imagine a submap contained within each of these high-level cards. If we mentally double-click on any of the top three cards, contained within that card is its own two-dimensional story map. This can be seen in Figure 6.
Figure 6. Each card in a map can potentially contain a submap.
There are a number of advantages to using submaps rather than creating an immensely large single map, including:
- Submaps are more readable
- Submaps add what are essentially third and fourth dimensions to the map
- Submaps, like functions or method in a programming language, can be referenced from more than one place in the parent map
- Submaps can include cards that contain their own submaps
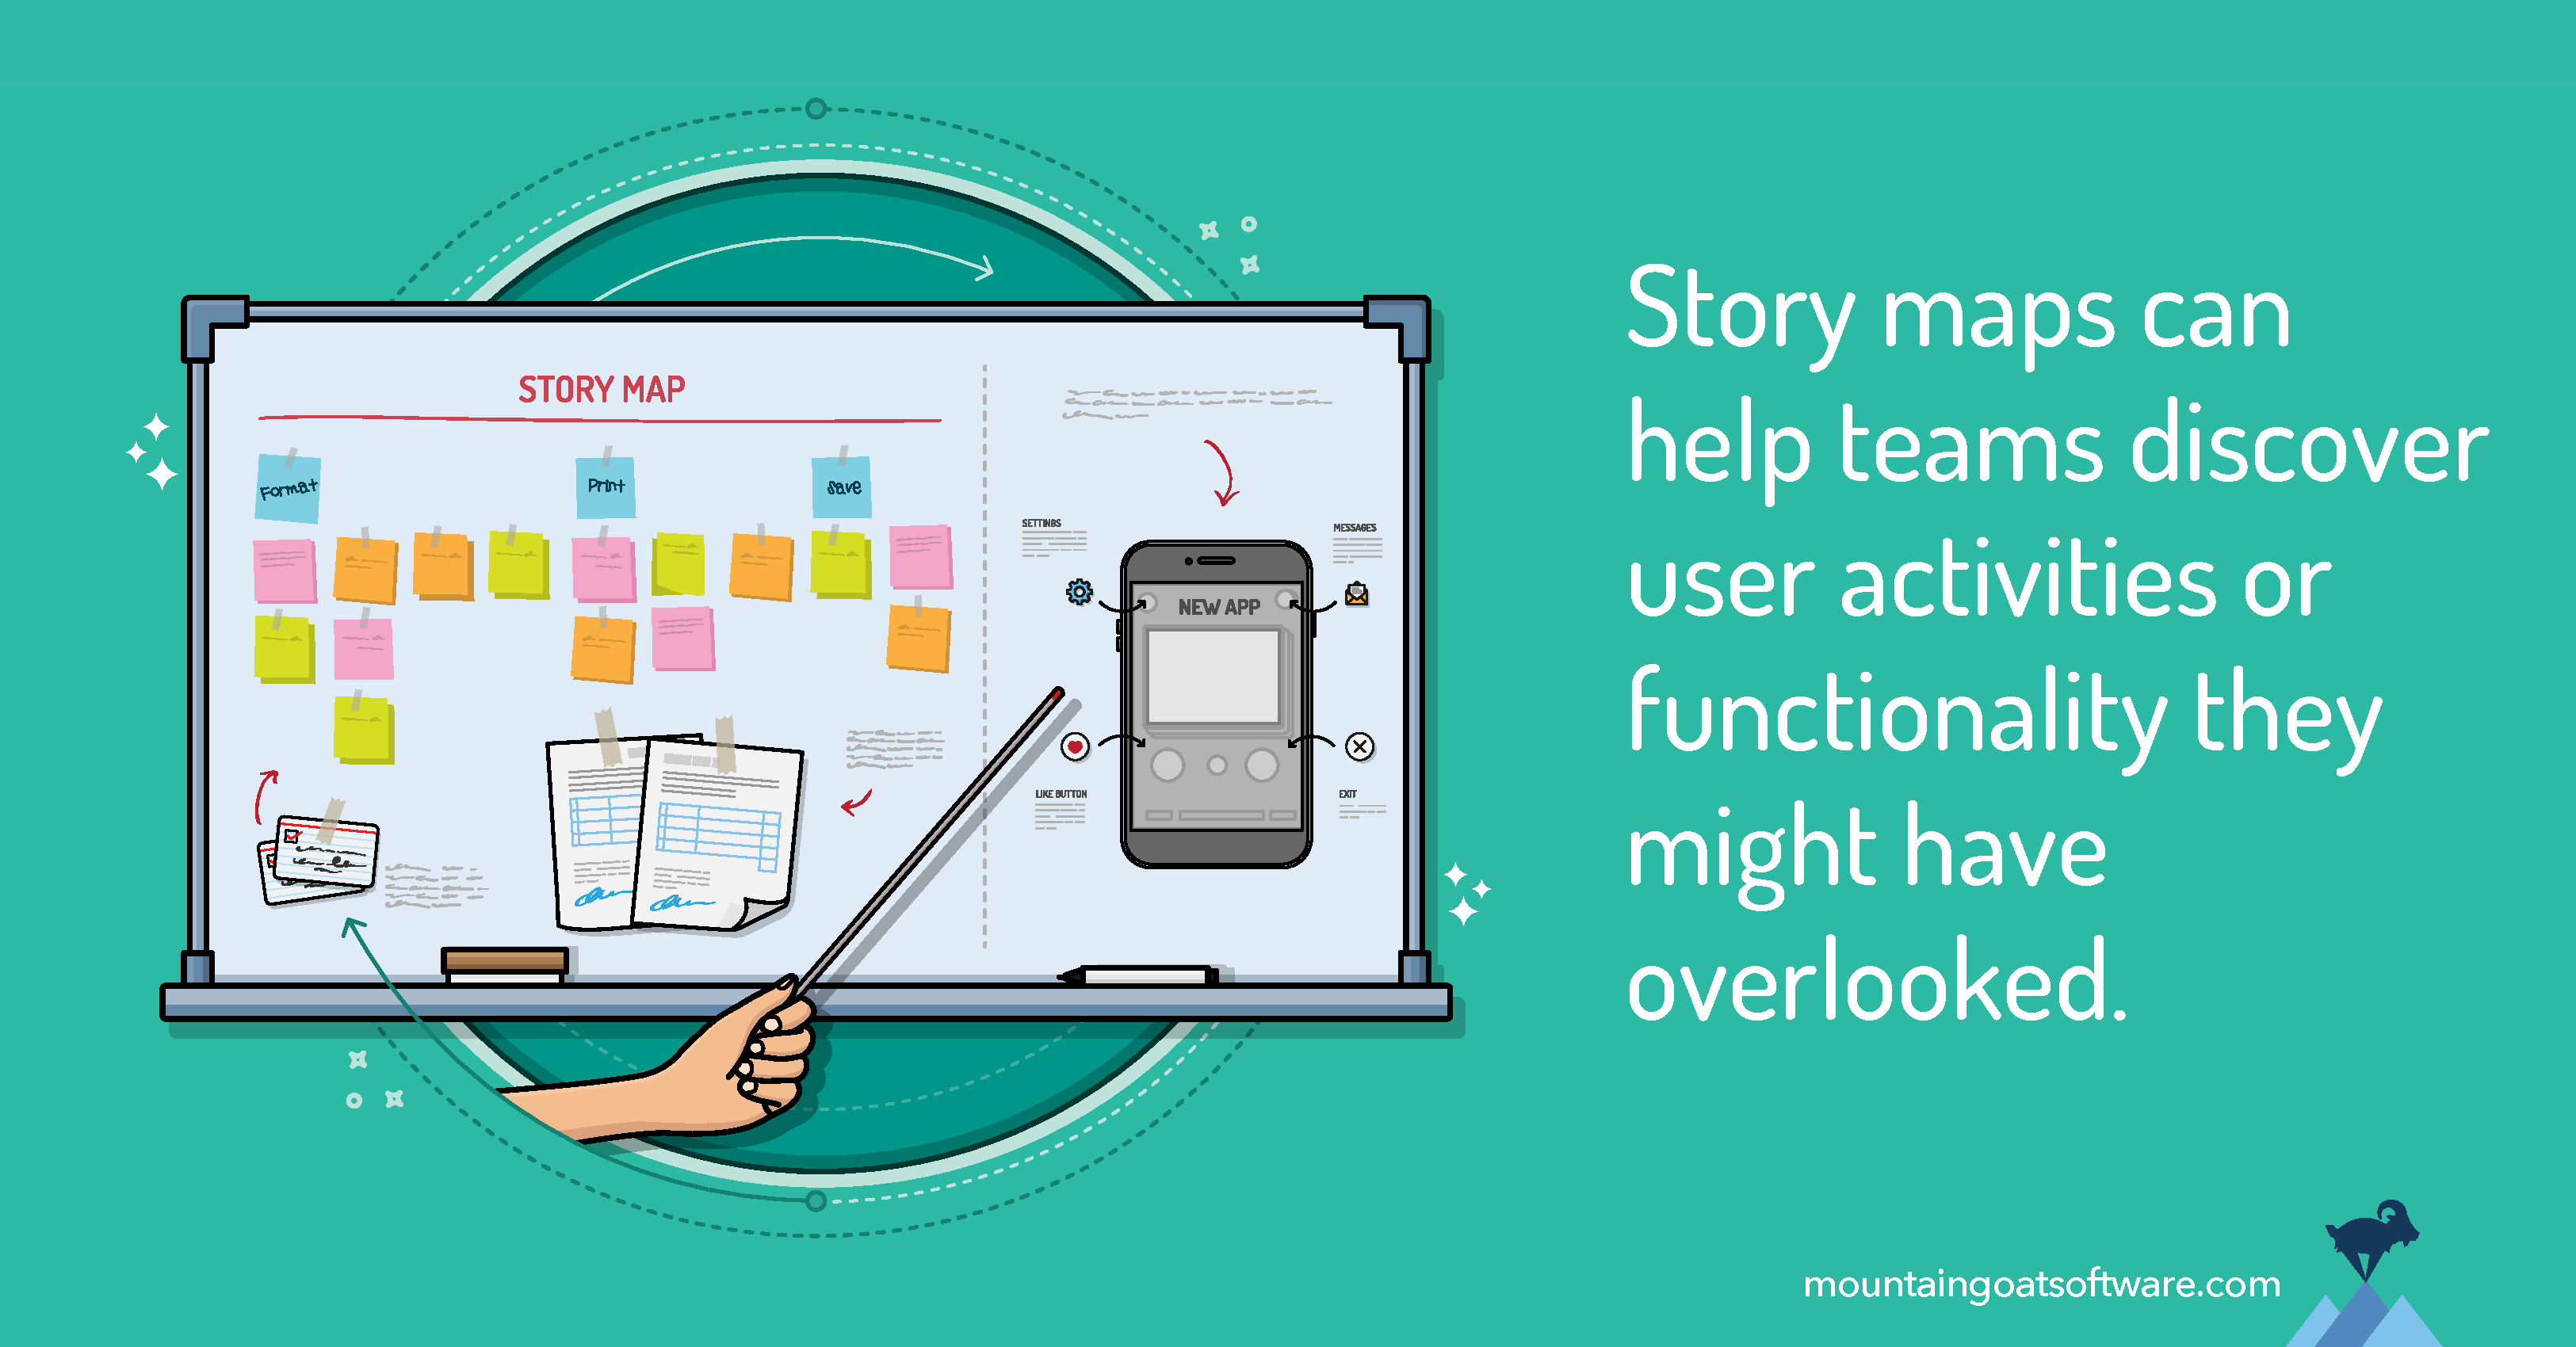
Story Maps Help Uncover Missing Functionality
Story maps can help teams discover user activities or functionality they might have overlooked. To do this, walk through the story map from a user experience perspective and see if anything is missing.
In your walk-through, it can be very helpful to ask a few questions in each step, such as:
- What will a user most likely want to do next?
- What mistakes could a user make here?
- What could confuse a user at this point?
- What additional information could a user need?
If your product has multiple types of users, ask these questions for each type of user.
Wearing a user’s shoes to walk through our sample story map about expense reports, I realized that users are often going to need to attach receipts for some expenses. So I’ll need to add that as a new step.
And maybe the team suggests that the product needs to allow users to do this two ways. First, they suggest, it would be nice if the system itself could activate a device’s camera and scan a receipt directly. Second, users will need an ability to attach an existing PDF or image to the receipt. Add each of these alternatives below the Attach Receipts card on the story map.
Use a Story Map to Visualize Releases
Because story maps are arranged vertically in priority order, a product owner can use the story map to convey a product roadmap showing the intended sequence of features in one or more upcoming releases.
To draw a roadmap, add a horizontal line to the map and then drag above the line everything that must be included in the next release or version of the product.
Returning to the expense reporting system used earlier, a releasable product would give users the ability to log in, and make a new expense report. So these are placed above the line in Figure 7.
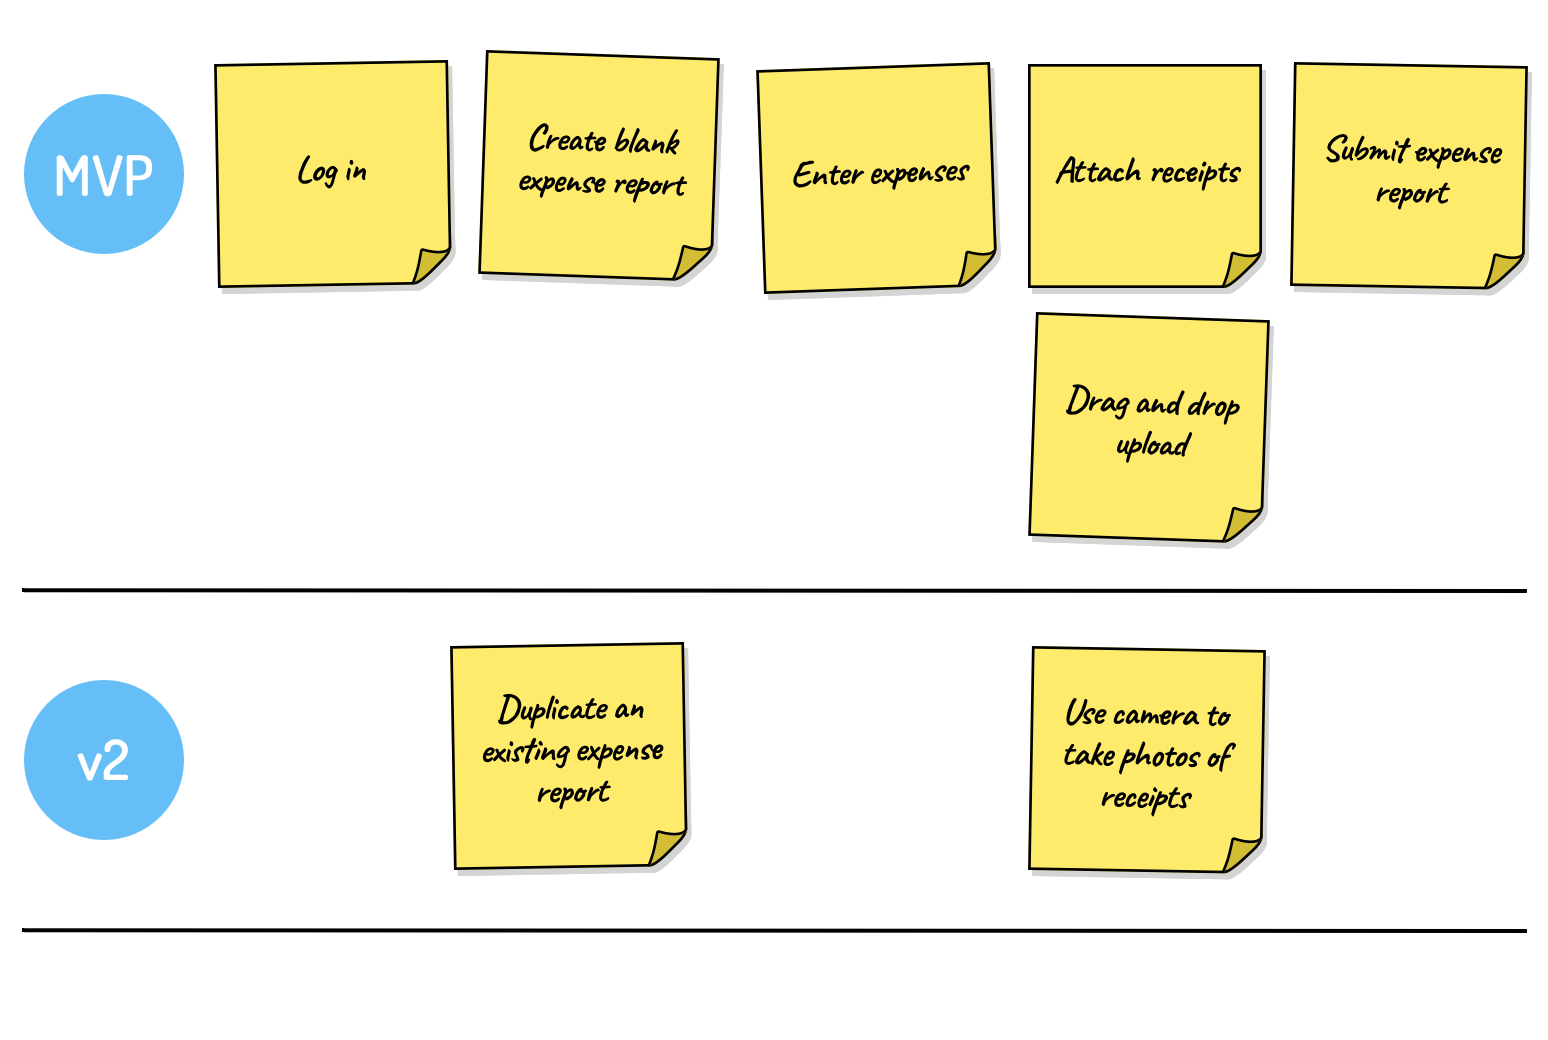
Figure 7. Lines can be added to a story map to indicate planned releases.
Let’s assume that starting with a new blank report is good enough at first. The team can add the ability to duplicate an existing expense report later, so that is placed below the top line indicating it is not in the first release.
Users will need to attach receipts, but dragging and dropping existing image files is all that will be supported in the MVP release, as indicated by the label to the left of the top portion of the map. Activating the mobile device’s camera to take photos of receipts is planned to be added in version two and is placed below the line.
Would You Like to Learn to Use Story Maps, Live and Online With Me?
Story maps are my favorite tool to help product owners, stakeholders, and developers understand user needs and the interconnectedness of those needs. I find them extremely efficient for brainstorming the product backlog items that will be needed to achieve a team’s next significant objective.
I teach a one-day Better User Stories class, live and online. You'll learn how to fix common user stories problems including adding detail and splitting stories. The class also tackles story mapping, including practical exercises for creating a valuable story map. Find out more and register for an upcoming class.
Do you use story maps? Have you found them helpful? What challenges have you experienced with story maps? Please share your thoughts in the comments below.