Progress on a Scrum project can be tracked by means of a release burndown chart. The ScrumMaster should update the release burndown chart at the end of each sprint.
The horizontal axis of the sprint burndown chart shows the sprints; the vertical axis shows the amount of work remaining at the start of each sprint. Work remaining can be shown in whatever unit the team prefers -- story points, ideal days, team days and so on.
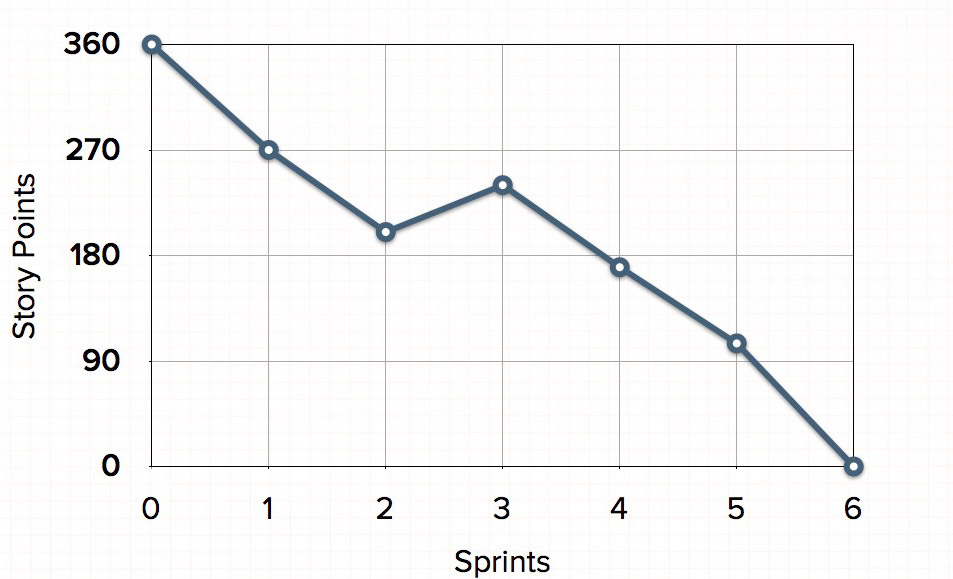
On the burndown chart pictured above, the team started a project that was planned to be six sprints. They began with 360 story points of work. To finish within six sprints, they planned to average 60 points per sprint. The first sprint went well and they completed 90, leaving 270.
Things continued to progress well during the second sprint, but during the third sprint, the estimated work remaining actually burned up. This could have been because work was added to the project or because the team changed some estimates of the remaining work. After that, things again went well.
This type of release burndown chart works very well in many situations and for many teams. However, on projects with lots of changing requirements, you may want to look at an alternative release burndown chart as a way of keeping your agile project on track.
The burndown chart is an essential part of any agile project and is a way for the team to clearly see what is happening and how progress is being made during each sprint.
Last update: December 14th, 2022