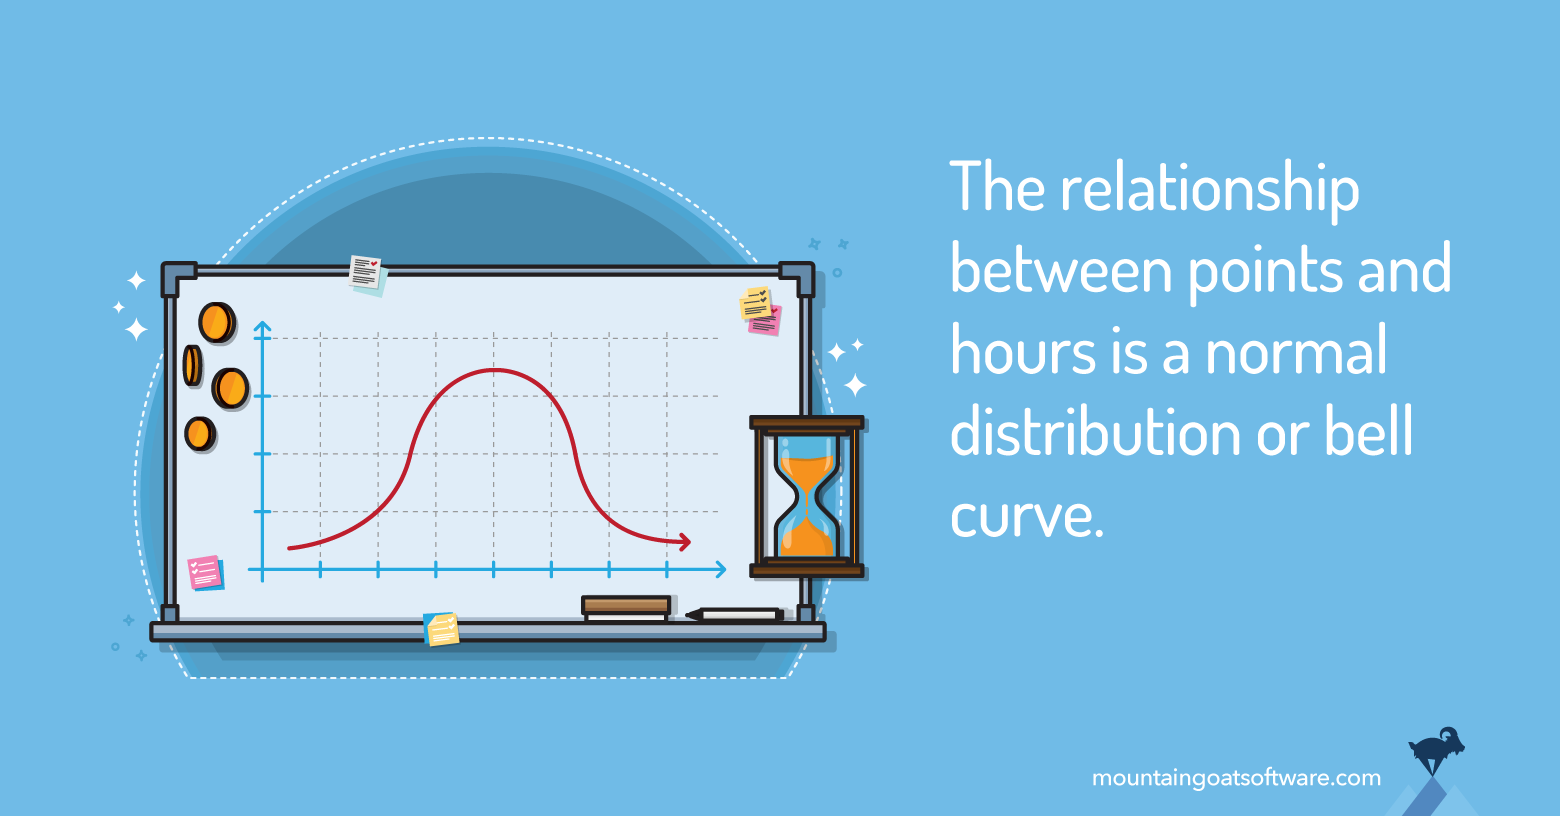


I'm often asked about the relationship between story points and hours. People who ask are usually looking for me to say something like "one story point = 8.3 hours." Well, that just isn't the case (especially since I made up 8.3 hours). Let's see what the real relationship is between the agile point system vs. hours system. Suppose for some reason you have tracked how long every one-story-point story took to develop for a given team. If you graphed that data you would have something that would look like this:

This shows that some stories took more time than others and some stories took less time, but overall the amount of time spent on your one-point stories takes on the shape of the familiar normal distribution.
Now suppose you had also tracked the amount of time spent on two-point user stories. Graphing that data as well, we would see something like this:

If the one-point stories are centered around a mean of x, ideally the two-point stories will be centered around a mean of 2x. This will never be exactly the case, of course, but a team that does a good job of estimating will be sufficiently close for reliable plans to be made from their estimates. What these two figures show us is that is the relationship between points and hours is a distribution. One point equals a distribution with a mean of x and some standard deviation. The same is true, of course, for two-point stories, and so on... By the way, notice that I've drawn the distributions of one- and two-point stories as having overlapping tails. It should be totally realistic that the biggest story that a team put "one story point" on might turn out to take more time than the smallest story they put a two on. After all, no team can estimate with perfect insight, especially at the story point level. So, while the tails of the one- and two-point distributions will overlap, it would be extraordinarily unlikely that the tails of, say, the one- and thirteen-point distributions will overlap.
Last update: July 28th, 2020