
Managing Risk on Agile Projects with the Risk Burndown Chart
Risk management is a central part of traditional project management and is included as one of the knowledge areas in the Project Management Institute’s (PMI) body of knowledge. In many of my classes, participants ask how Scrum and agile address risk management. Some are concerned that agile or Scrum ignore risk management completely. Let’s see why this is the case. First, a great deal of explicit risk management becomes unnecessary when a project uses an agile approach. The short iterations, single-minded focus on working software, heavy emphasis on automated tests, and frequent customer deliveries help teams avoid the biggest risk most projects face—that of eventually delivering nothing. So, it is not surprising that many agile projects forgo any form of explicit risk management. To put it in risk management terms, for these projects the likely savings from explicitly managing risks is outweighed by the cost of explicitly managing risk.
So while some short and inherently low-risk projects can be safely undertaken without any formal risk management, other projects are likely to benefit from explicitly managing risk. To see how we can do this, I want to describe a technique originally introduced by John Brothers in The Agile Times in 2004: the risk burndown chart.
Before we create a risk burndown chart we first need something akin to the typical risk census, which is merely a list of a project’s top risks along with the probability of the risk occurring and the size of the loss that would occur if it did. An example is shown in the following table, which I’ve simplified by eliminating a few columns that are not essential to this post:
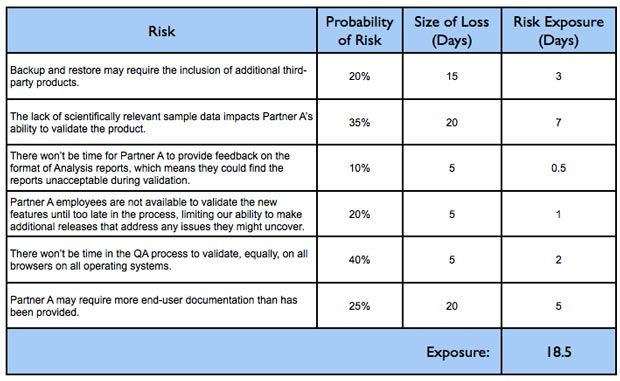
Our simple risk census here describes each risk, provides an estimate of how likely the risk is to occur, the impact to the schedule if the risk did occur, and then the expected exposure to the risk which is the probability multiplied by the size of the loss. I recommend creating a risk census during the first sprint planning meeting and then updating it quickly during subsequent planning meetings as new risks are identified or as the probabilities or sizes of known risks change.
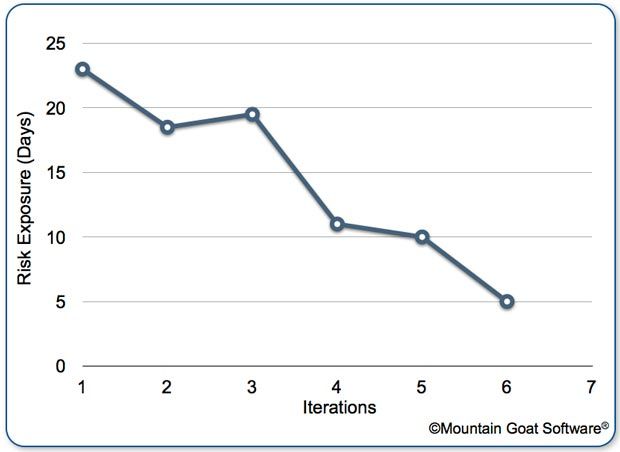
The risk burndown chart is then created by plotting the sum of the risk exposure values from the census. My recommendation is to sum only the top ten risks even if the team has identified more. Do this even if the top ten change over the course of the project. A sample risk burndown chart will look like this:
As with a regular release burndown chart, we should see a linear drop in risk over the course of the project, as shown in the red line of this next risk burndown chart.
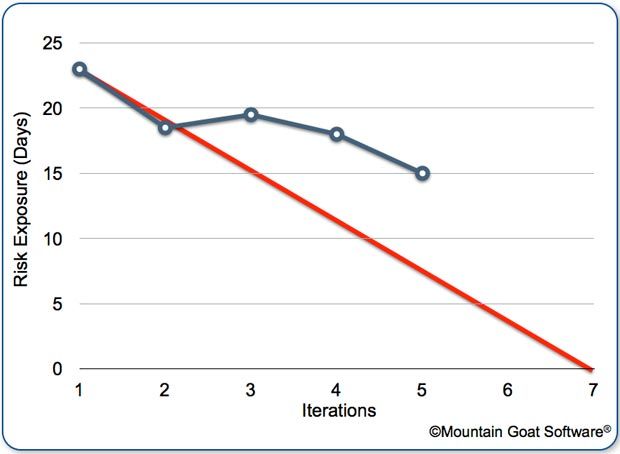
When risk is not coming down at the appropriate rate, the team may want to budget some time in the next sprint to work directly on risk mitigation.
So as we can see from these examples, it is possible for risk management and agile project management to coexist on projects that need to explicitly do so. And the risk burndown chart provides a convenient way of visualizing changes in risk.

Use a Pre-Mortem to Identify Project Risks Before They Occur
FeaturedTalking about problems after they occur is too late. A pre-mortem can help a team avoid problems.

New To Agile Or Scrum
FeaturedAgile helps teams deliver value sooner, learn faster, and adapt when plans change. Use this guide to understand what agile is, how it differs from Scrum, when agile helps, and where to go next if you are just…
Estimating & Planning in Agile: A 2026 Field Guide
FeaturedShare a practical 2026 field guide to agile estimating and planning, with current guidance for making useful forecasts without false certainty. Download a PDF of this you can share.
Agile Teams and Risk Management
Ahh, it's fall. Not only does it bring the return of great, cooler weather but it ...

The Five Possible Estimates and Which One Your Team Should Use
Unless team members have discussed it, they are almost certainly providing different types of estimates.

Sprint Backlog
Advice on Conducting Agile Project Kickoff Meetings
Traditionally managed projects begin with a kickoff meeting. Here’s why and how agile projects can do the same.
Improving On Traditional Release Burndown Charts
Use release burndown charts to see progress and scope together.
The Benefits of Feature Teams
Moving away from component teams is a difficult but necessary step for those who want to adopt an agile project management approach.
Should a Team Assign Work During Sprint Planning?
Some teams assign all tasks upfront. Others don’t.

Why Smart Teams Overcommit And How Leaders Make It Worse
Understand how leader pressure can push smart teams into unrealistic commitments.
The Cost of Change Curve Is Outdated
The cost-of-change curve isn’t what it used to be—modern tools, agile practices, and AI have dramatically flattened it.

Estimating and Planning Are Necessary for Maximizing Delivered Value
See why planning and estimating still matter for maximizing value in agile work.

3 Ways to Help Agile Teams Plan Despite Uncertainty
We might not like ambiguity, but it’s a fact of life. Find out how to plan with uncertainty in mind.
The Just Right Size for Agile Teams
Find the team size that balances collaboration with overhead.