
Suppose you have a flight to catch later today. How far ahead of your flight should you leave for the airport?
This, of course, depends on many factors. For example:
- How far away from the airport you currently are
- How busy do you anticipate the airport will be? This, in turn, will be impacted by the time of day your flight is.
- The day of the week
- Whether today is a holiday
When my wife and I were newlyweds, the question of how far ahead to leave for a flight was our most frequent source of disagreements.
Why Our Estimates Were So Different
I don’t like the stress of travel. And rather than making it more stressful, I like to arrive well before a flight’s departure time. It’s not like the time is wasted. I can read a book or there’s always email to answer.
My wife, on the other hand, likes to arrive at the gate just as the agent is ready to close the door. While growing up, her dad was an airline pilot. Whenever her family would travel, they’d fly standby, meaning they might or might not get on the plane. And if they didn’t, no worries, another plane would take off sometime.
So, my wife was accustomed to arriving as late as possible. I wanted to arrive early enough there would be no practical chance I’d miss a flight.
When we were estimating how far ahead to leave for the airport we were estimating entirely different things.
My wife was planning based on an optimistic estimate: The time that would let her arrive at the gate just before the door closed.
I was providing a risk-averse estimate.
It took us perhaps a year and a few trips as a newly married couple to figure this out and find an appropriate compromise.
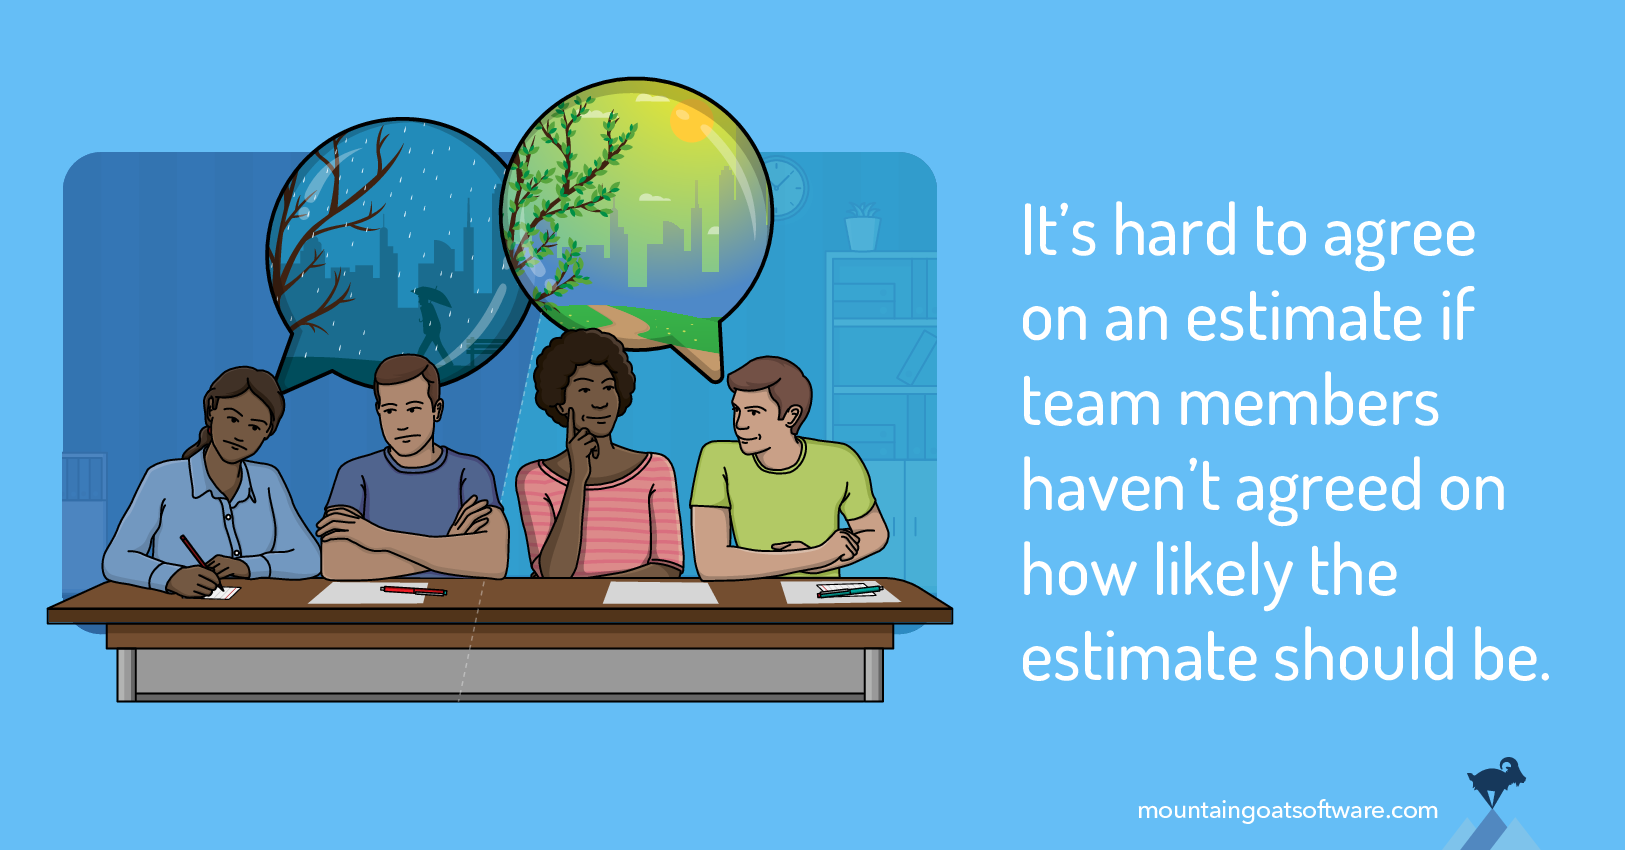
I see many teams struggle with this exact situation—some developers are providing optimistic estimates, others are providing risk-averse estimates. With such differing views on what they are estimating, team members will, of course, find it difficult (or impossible) to agree on a single value as their estimate.
The Five Possible Estimates
When asked to provide an estimate for a product backlog item, there are five possible values you could provide.
Ideal / Optimisic and Worst-Case Estimates
First, you could provide an ideal or optimistic estimate. This is an estimate of everything going well. How often does everything go well?
Alternatively, a team could provide a worst-case estimate. This is an estimate of the most effort that may be needed to deliver something.
I sometimes must rein teams in from including everything and making the worst case ridiculous. A worst-case estimate does not need to account for meteor strikes, earthquakes, hurricanes, the source repository server catching on fire, all Amazon AWS servers going down for a week, and so on.
Stop short of providing a ridiculous worst-case estimate.
A Risk-Averse Estimate
Instead of the worst-case estimate, teams could provide a risk-averse estimate. A team providing this wants to be safe but knows they can’t include meteor strikes in their estimates. This is the estimate I was using when leaving early for the airport with my wife.
Median and Most-Likely Estimates
A fourth option would be to provide an estimate of the median amount of effort. This is the midpoint. Half the time it will take more effort than this, half the time it will take less.
Finally, a team could provide an estimate of the most likely effort. If you could somehow do the work a hundred times, this is the amount of effort it would most frequently take.
Graphing the Types of Estimates
Before deciding which of these estimates a team should provide, let’s put them on a graph.
Let’s start with the shape of the line.
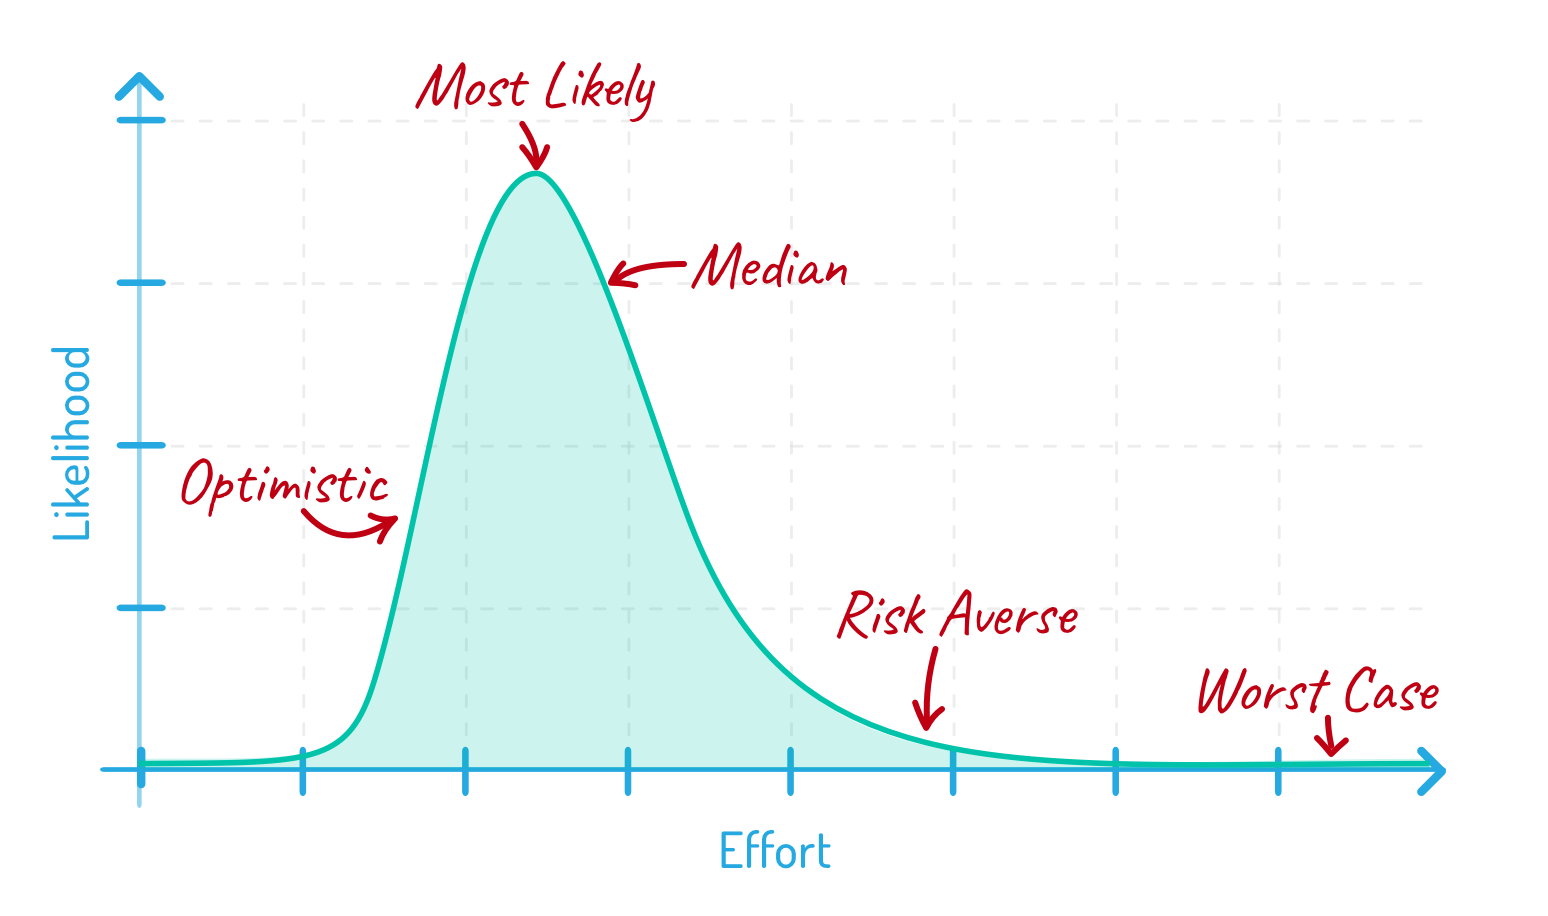
The chart below shows the effort or amount of time something will take across the horizontal axis.
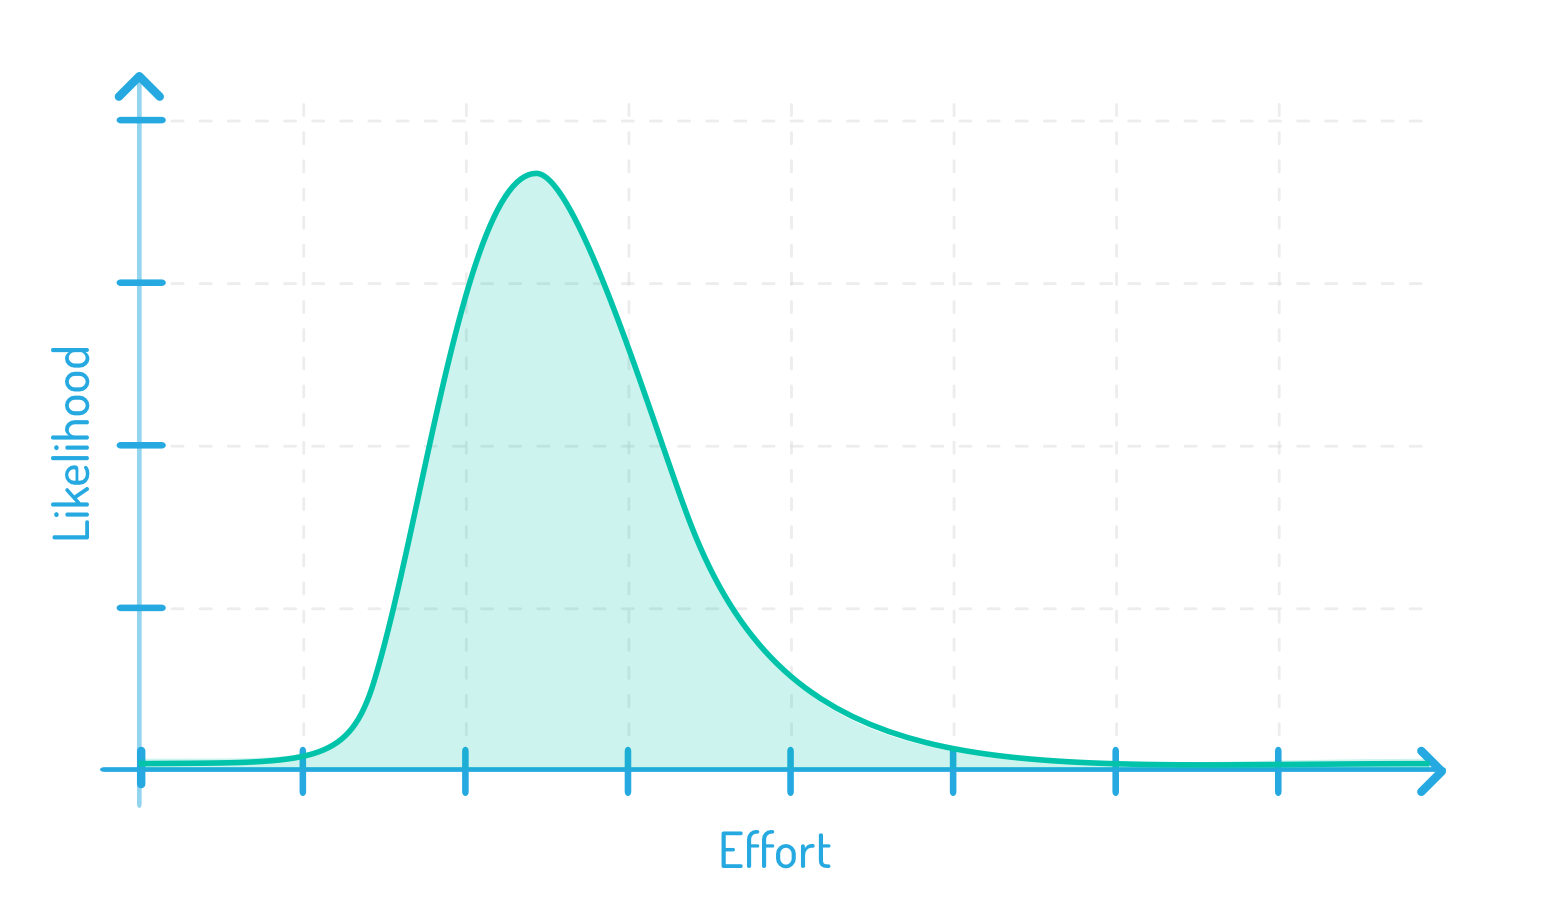
On the vertical, the likelihood of it taking that long. This line is a lognormal distribution and it is how most time-based tasks are distributed.
To see why, think about going grocery shopping. There is essentially zero likelihood that going grocery shopping will take no time at all.
Most of your trips to the market take about the same amount of time. That’s the big hump in the chart. And some of your trips take longer. Some, a lot longer.
I recently discovered Cosmic Crisp apples. They’re just a newer type of apple--like Fuji, Pink Lady, or Honeycrisp. I love them, so when I ran out, I wanted some more.
My usual store didn’t have any. Neither did the second store I went to. I finally found them at the third. That trip to do my shopping would be way out on the right.
Effort is distributed like this rather than symmetrically because there’s no realistic chance that doing something takes no amount of time.
And there’s a slight chance that doing it takes a really long amount of time. That creates this long tail to the right.
Adding the Estimate Types
Let’s put the five types of estimates on this chart and discuss which is best for a team to provide.
The Worst-Case Estimate
Our worst-case estimate goes way to the right. When team members give what they consider a worst-case estimate, it’s probably 95–99% safe. That means 95–99% of the area under the line is to the left of this point .
What about the space on the line that continues further out to the right beyond what I’ve labeled the worst case? That’s for what I called earlier the ridiculous worst case. All the extra time along the horizontal line represents the change from maybe 98 to to 99.9%. As before, there’s no value in having a team come up with a ridiculous, worst-case estimate.
The Risk-Averse Estimate
Not as far out to the right is the risk-averse estimate. Think of a risk-averse estimate as being about 90% safe. Things could go wrong, and it could take longer. Risk averse is a good, safe estimate. But it isn’t the worst case.
The Optimistic / Ideal Estimate
On the far left of the graph is the optimistic estimate. This is everything going well. When developers give this type of estimate, most are thinking it’s something they’ll make perhaps 10% of the time.
Note the balance between optimistic and risk-averse: each lops off about 10% of the total area under the curve.
The Most-Likely Estimate
The most-likely estimate will always be the highest point on the chart. In a lognormal distribution, the most likely estimate will always be somewhere to the left of the median estimate. This is because of the long, gradually declining right tail of a lognormal distribution.
The Median Estimate
Finally, the median estimate is at the point where half the area under the curve is to the left and half is to the right. This indicates that half the time the actual effort will take less than the median and half the time the actual will take more.
Which Estimate Is Best?
So, which of these estimates should team members provide? Let’s consider the options.
An optimistic estimate isn’t very useful. Remember an optimistic estimate is one the team will make only about 10% of the time. That’s just too infrequent to use as the basis of your product backlog estimates.
The same is true for risk averse and worst case. Those are just too pessimistic. You don’t want to build a plan based on estimates that pessimistic. It’s unrealistic and no one would ever approve the project.
A good choice we haven’t considered would be the mean estimate—the average of all possible completion times. With a lognormal distribution like product backlog item completion times will be, the mean will be to the right of the median. That’s because the mean accounts for all those really far right data points. Those pull the mean to the right of the median.
Although using mean values would be nice, they’re too hard to estimate directly.
My recommendation is to estimate the most likely or the median value. I personally prefer median but have worked with plenty of successful teams that estimate the most-likely.
Discuss This with the Team
The most important thing is to discuss with all team members the type of estimate they should provide. If you’ve never discussed the type of estimate with team members, you almost certainly have people providing different types of estimates.
This is supported by research conducted by Magne Jørgensen, who is the chief research scientist and professor at the Simula Research Lab in Oslo, Norway. His research has greatly influenced my views.
In one study he asked developers what type of estimate they had provided when not told in advance to provide a certain type.
Most common was an optimistic estimate (which he called an ideal estimate), provided by 37% of survey respondents. But 27% had provided a most-likely estimate. And a full 22% weren’t aware of what type of estimate they had provided.
If a team has not had this discussion, team members are unknowingly providing different types of estimates. No wonder it can be hard to gain agreement on how many story points one item should have when compared to others, with one team member thinking in terms of an optimistic estimate and another thinking in terms of a risk-averse estimate of the same product backlog item.
Once you have this discussion and get everyone to agree to think in terms of either a most-likely or median estimate when deciding on story points, you’ll find gaining agreement on an estimate much easier to achieve.
Last update: July 15th, 2024