I normally write about a new agile project management technique only after I’ve used it for a couple of years and found it successful in a couple of different contexts. In this post I want to share such a technique. It’s a statistical technique called “resampling” that I’ve become quite fond of for making predictions about future velocity, a method for measuring the rate at which agile teams consistently deliver value. Resampling is based on the idea that things we’ll observe in the future will be similar to the things we’ve observed in the past. In the examples below we’re saying the velocities a project team will see in the future will be similar to ones that occurred in the past. Resampling works by imagining we’ve put all old sample velocities into a bag. If we have past velocities of 18, 17, 18, 19, 22, and 20 imagine each of those written on separate slips of paper and dropped into a bag. Note we’ll have two slips of paper with “18? because our Agile or Scrum team here had that velocity twice.
To predict future velocity we reach into the bag and pull out one piece of paper. What’s written on it is our prediction of velocity in the first sprint. To predict the team’s velocity in the second sprint, we reach into the bag and pull out another slip of paper. But, before we do that, it’s important we put the first slip of paper back into the bag. This is called “resampling with replacement.” We want to replace because for any given sprint the team is equally likely to get any of their past velocities. Suppose we’re trying to predict how much work a given team can complete in a coming ten-sprint period. We would resample (with replacement) ten times. Each time we’d note the number we pulled from the bag. After we pull the tenth slip, we would sum the ten values we pulled and that is one possible result for this team over the coming ten-sprint period. It’s quite possible we could get lucky and pull the highest-valued slip (22) each of ten times. Or we could pull the worst-case slip, 17, each of the ten times. But these are unlikely. If we could in some way in the real world run the project hundreds or thousands of times, we would occasionally see the team repeat their highest (or lowest) velocity every sprint but it wouldn’t happen very often. Since we can’t run the project hundreds or thousands of times in the real world, we want to simulate doing so on a computer. We can then learn a great deal from the results.
For example, suppose we are ready to start a project that will have ten sprints. It would be helpful to know things like:
- what is the average amount of work completed over those ten sprints?
- what percentage of the time does the team finish more than say 200 points of work?
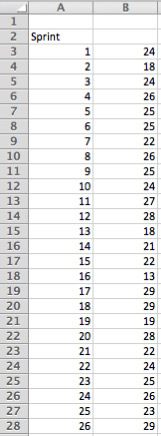
It’s actually quite straightforward to answer these questions using simulation and resampling. Let’s see how it’s done. You can follow along with this velocity resampling spreadsheet. In the figure below (from that spreadsheet), cells B3 through B28 show historical velocity.

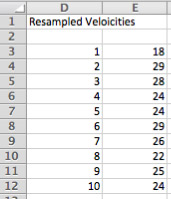
Because our hypothetical project here involves ten sprints, cells D3 through E12 show the sprint numbers (1-10) and a resampled velocity for each.

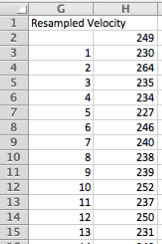
Selecting a resampled velocity is simply a matter of randomly selecting any velocity from the B3:B28 range (our 26 historical velocities). This is done with the formula: =SMALL($B$3:$B$28,INT(COUNT($B$3:$B$28)*RAND())+1) which generates a random number between 1 and 26 and then uses the SMALL method to select that item from the list of values. (Note: SMALL selects the nth smallest item from the list of values; we could have used LARGE instead. The goal is just to randomly select a value from the list of velocity in B3:B28.) Because we're using the RAND() function in E3:E12, any time you change any cell in the spreadsheet, the values in E3:E12 change. This is a desirable side effect of using RAND(). E3:E12 simulates one run of ten sprints. We'd like, though, to simulate 100, 200 or even 1000 runs of the project (each with ten sprints in it). To do this is slightly tricky because we're going to use something a lot of people aren't familiar with in Excel: a Data Table. In our spreadsheet, the Data Table is in G3 through H202, a portion of which is shown below.

The G column shows a sprint number, the H column shows a sum of ten velocities, representing one ten-sprint project in our case. In the example, in the figure at left you can see that the first simulation of the project yielded a total of 230 points done in the ten sprints of the project. In the next row (cell H4, but labeled '2' in column G of the spreadsheet), the team got a much higher simulated velocity, 264. In the spreadsheet, I repeated this 200 times but you can do more or less as you prefer. For brief instructions on how to create a data table, see the end of this post. For more complete instructions, see the Excel documentation. Armed with 200 simulations of the ten sprints of the project (or ideally even more), we can now answer the question we started with, which is, How much can this team finish in ten sprints? Cells E17 and E18 of the spreadsheet show the average total work finished from the 200 simulations and the standard deviation around that work.

In this case the resampled average is 240 points (in ten sprints) with a standard deviation of 12. This means our single best guess (50/50) of how much the team can complete is 240 points. Knowing that 95% of the time the value will be within two standard deviations we know that there is a 95% chance of finishing between 240 +/- (2*12), which is 216 to 264 points. If my boss wants a guarantee, I might say, "We can pretty much guarantee 216." Technically I know the math doesn't support the guarantee. There's about a 2.5% chance we fall below that. However, humans are involved and just about any good team I've been on would be happy to kick in some extra effort sometime over the ten sprints to finish the 216 we committed to rather finishing with 210 if that 2.5% chance does occur. Another interesting issue we can address with this type of simulation is the boss who says, "I need you to get 250 points done in the next 10 sprints." You can see how likely this is to occur by scanning down the resampled values (the H column) and seeing how often the value there equals or exceeds the value the boss, client or customer wants. The spreadsheet is set to do this automatically as shown in this figure:

Type in the total number of points desired in L20, the spreadsheet will see how many times that number or higher occurred in the simulations (L21) and then report it as a percentage (L22). In this example, if the boss wants 250 points in 10 sprints, we can reply that while the team will try to achieve that, historical data shows that there is only a 20% chance of that occurring. Hopefully you've found these examples of working with resampling to simulate projects helpful. There are many more things that can be done using this technique. I'll provide additional examples in future posts. You can download the velocity resampling spreadsheet used in this examples.
Note on Creating a Data Table
To create a Data Table, in cell H2 (the cell above where you want to put the simulation results), enter the formula you want to calculate as a result of each simulation. Because we're interested in the sum of their ten sprints worth of velocity, I've entered: =SUM($E$3:$E$12) Next, if you're interested fill the sprint cells (the G column) with numbers from 1 to 200. Then highlight cells G2:through 202 (assuming you want to do 200 simulations as I've done here). Notice you're highlighting starting one row above our simulations through the last row of simulations. Now create the data table. In my version of Excel (Mac 2011), I do this by selecting Data | What If | Data Tables. You'll get a little dialog box asking for the row or column input cell. Move the cursor to Column Input cell and select G2. Close the dialog and you'll see the 200 rows fill with simulation results.
Last update: April 25th, 2023


