Are 64% of Features Really Rarely or Never Used?

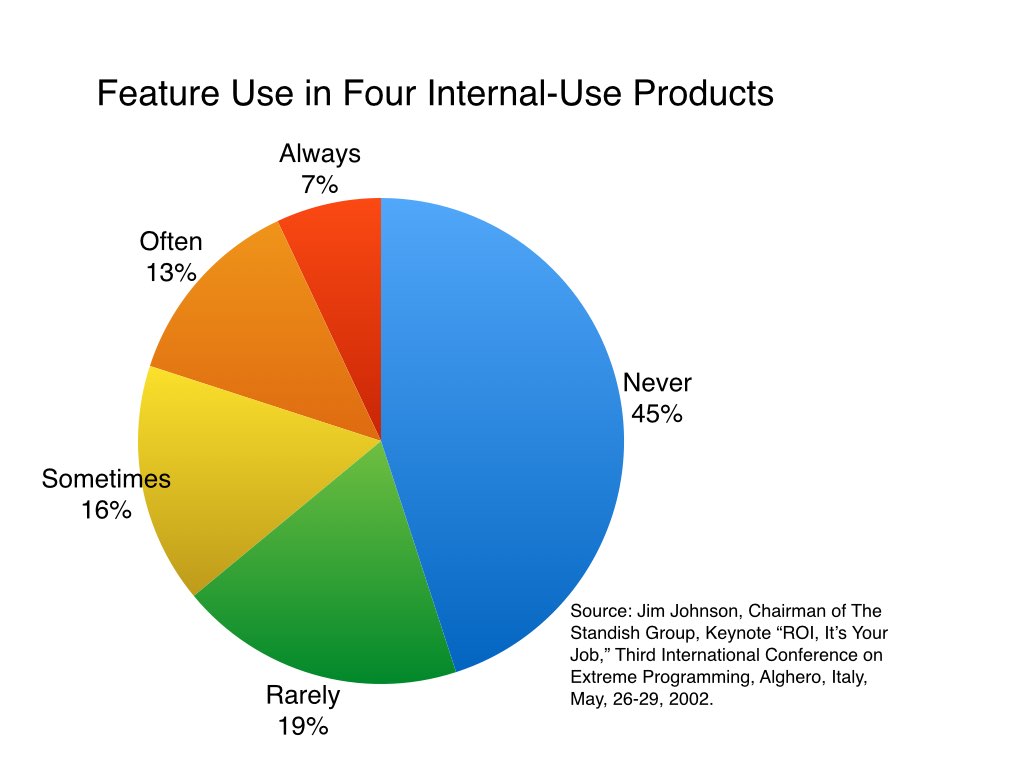
A very oft-cited metric is that 64 percent of features in products are “rarely or never used.” The source for this claim was Jim Johnson, chairman of the Standish Group, who presented it in a keynote at the XP 2002 conference in Sardinia. The data Johnson presented can be seen in the following chart.

Pie Chart of Feature Use in Four Internal-Use Products

Johnson’s data has been repeated again and again to the extent that those citing it either don’t understand its origins or never bothered to check into them.

The misuse or perhaps just overuse of this data has been bothering me for a while, so I decided to investigate it. I was pretty sure of the facts but didn’t want to rely solely on my memory, so I got in touch with the Standish Group, and they were very helpful in clarifying the data.

The results Jim Johnson presented at XP 2002 and that have been repeated so often were based on a study of four internal applications. Yes, four applications. And, yes, all internal-use applications. No commercial products.

So, if you’re citing this data and using it to imply that every product out there contains 64 percent “rarely or never used features,” please stop. Please be clear that the study was of four internally developed projects at four companies.


Get Your Customized Elements of Agile℠ Assessment

Get Your Customized Elements of Agile℠ Assessment

Find out how your team is progressing in their mastery of the 20 key Elements of Agile.

19

Posted:

Tagged:

Mike Cohn

About the Author

Mike Cohn specializes in helping companies adopt and improve their use of agile processes and techniques to build extremely high-performance teams. He is the author of User Stories Applied for Agile Software Development, Agile Estimating and Planning, and Succeeding with Agile as well as the Better User Stories video course. Mike is a founding member of the Agile Alliance and Scrum Alliance and can be reached at hello@mountaingoatsoftware.com. If you want to succeed with agile, you can also have Mike email you a short tip each week.

19 Comments:

HONK HONK said…

😊 the devil is in the detail!

Mike Cohn said…

Absolutely!

Magne said…

Thanks for questioning this over-use of a study hardly anyone knows what really means. Typically it comes with the extra: “45% of the features delivered by TRADITIONAL projects are never used” - meaning that it is a strong motivation for agile development.
Apart from the question - answered by this blog - about how many projects they studied, there are numerous other issues that should have stopped us from using the results, such as:
1) What does the results mean? Does it mean that the features were never used by anyone, had never been used by anyone and would never be used by anyone in the future? Or did it mean something else? Hard to know.
2) If this (really never) is the meaning, how did they conduct the study to know this? I can see a lot of problems finding out to what extent this was the case.
3) How were the applications selected? I know agile projects delivering software that are not used at all and could consequently produce a study where I could make an even worse claim: “100% of the features delivered by AGILE projects are never used”. Are these worst cases, average cases, random sample, ....
4) The Standish group has a very bad record of study design and misleading results. Not reporting the study design (as they did here) may be good for them, but should stop us from listening/using their results.
The use of the results is, I think, an example of: “Don’t check a good story”. Good that someone does!
PS: I just wrote a paper finding that agile (but not all types of agile) did lead to more successful projects in terms of client benefits, so this is not about whether we should believe that agile leads to benefits or not.

Mike Cohn said…

Thanks, Magne.
The constant references to this study just kept bothering me. It seemed like the results were being accepted more and more as absolute, universal fact when it seems like there’s a lot to be questioned here and not even Standish was proposing the data to apply to all projects.
Yes, you bring up a great list of issues with their data.
As for your (1) absolutely—the whole time issue is key. Survey a group too soon in their use of a system and, of course, many advanced features will never be used. In writing this little post I really tried to find an article I came across a few years ago that was about feature use in Microsoft Office. It seemed like a good study. It looked at feature use by individuals and then feature use by the “workgroups” those individuals were in. I think the workgroups were about 10 people on average. I’m not going to guess at the percentages but they were quite low for individuals. That is, you or I individually don’t use much of, say, Word on a regular basis. And even the features we use say “occasionally” isn’t very big. But our “workgroup” when combined used a pretty good percentage of each of the Office products they measured. It was really fascinating and I wish I could have found it again. Unfortunately googling for things like “Office feature usage” finds mostly marketing stuff.
For (2) and (3), they told me, “In late 1990s we were doing a round of our annual focus groups of CIO, VPIT, etc.  Many of the respondents expressed that they were over building their applications.  Some of them agreed to participant in a study to find out the extent of this issue.  The Sardinia data is from 100 software development projects for mission critical business applications.  The projects had to be in use for a year or more.  In 2001, we randomly selected 4 projects from 25 organizations that agreed to participant.  Then we did an inventory of the major features and functions. We then asked about the use of each of functions in a user/stakeholder workgroup.”
Which paper of yours shows agile leading to more successful projects?
I reference your work (with Stein Grimstad) on anchoring frequently, as well as much of your other work, and try to stay current with your papers at https://www.simula.no/people/m… <https: www.simula.no=”” people=”” magnej=”“>
Thanks for your comments.

Magne said…

Would be interesting to know what they actually and how they measured feature use.
So they claim that it’s randomly selected .... A very strange procedure to RANDOMLY select 4 projects from 25 organizations. Randomness is NOT a suitable method for small sample (an example of the incorrect “belief in small numbers”, i.e., that things get representative even for small, random samples). Either this is not really the case, or another example of their lack of skill in designing empirical studies. An attempt to select a representative sample would be better, but with 4 projects there is not much strength to generalize anyway. My guess is that their “random” sampling is more like their previous sampling, i.e., among the problematic projects ... Gives more headlines to have strong results!
Here is the new (just submitted) article, including stuff on agile: https://www.dropbox.com/s/tv4l…
Enjoy! Tell me if the link is not working.
Just now I’m writing on a paper summarizing results on how the effort time unit affects our estimates. Would be interesting to hear your feeling whether you (or other readers of this blog) experience or feel that estimates in work-hours vs. workdays tend to give different effort estimates, e.g., higher or lower effort estimates.
Magne

Magne said…

“We then asked about the use of each of functions in a user/stakeholder workgroup”. This supports, as you seem to suggest, that they are probably underestimating the feature usage. The only exception if when the user workgroup represents all feature usage. Some functionality is not used often or by many, but is still needed.

Mike Cohn said…

Absolutely.  That is a great point that it would be interesting to look at a user population that cover all used features.
There are definitely problems with (some, perhaps many) companies building unneeded features. (And I mean *unneeded*.) And then there are examples of features that aren’t financially justified.
I have data to support the claim, but I suspect the problem has improved over the last 15 years. In part that’s thanks to agile bringing attention to it. It’s also due to companies going out of business if they did it too much. (There’s a selection bias here: companies that do this do severely won’t be around if we were to measure them today.)
We also need to consider, though, that sometimes building a feature that doesn’t get used (perhaps at all) is still the cheapest way of discovering the right thing that users do want.

Mike Cohn said…

Thanks, Magne, for sharing your new paper. That’s fascinating that you found “success in terms of client benefit was only weakly correlated with success in terms of on time and on budget.” This comes up in some of my classes and we talk about how “on time” and “on budget” sound great. But I’ve been doing this for a long time and have had a very successful career—and I’ve rarely (if ever!) been on time and on budget. Yet I’ve often built projects that delighted my customers. So I loved your finding that clients benefit from flexibility.
I love your research. It is, of course, a model for how everyone should do it.

Mike Cohn said…

Thanks, Fabrice.

Stephen Tucker said…

Mike, are you sure about this, I thought that the Standish Group state that the numbers were based on a survey of over 2000 projects at over 1000 companies.

Mike Cohn said…

I’m 100% sure. I confirmed it with them by email before I wrote this.

Stephen Tucker said…

Thanks, for the fast reply.
I have been using a slide that stated the 2000 projects, I will remove it. 
I think the point is still valid that we often develop features that bring little value, and that agile can help reduce or delay developing features that bring little value.
Again thanks.

Mike Cohn said…

Stephen—
Standish Group did a later survey of “custom application development.” They found: 50% “hardly ever” used, 30% infrequently and 20% often. You can contact them and possibly get this in their “Exceeding Value” report. I don’t see a date on my copy but it sometime shortly before this blog. It doesn’t say how many projects they surveyed or how, which is consistently an issue with their research. (See the comments from Magne Jorgensen on this post for more about their research quality. He’s one of the most well-respected researchers in the world on software development topics and raises good criticisms of them.)
So you may want to use the numbers I just mentioned even without knowing much about the research.
And, yes, I agree that many teams build things that is of limited (or no) value.

Sam said…

The link is no longer working.

Mike Cohn said…

Sorry, Sam. I don’t recall exactly which of Magne’s papers that linked to initially, but you can see all his publications at https://www.simula.no/peopl… <https: www.simula.no=”” people=”” magnej=”“>. I can highly recommend reading everything he writes.

James Johnson said…

Hi Mike, the information you have is wrong.  The 2002 pie chart was based on 100 mission-critical applications that we were researching for a total cost of ownership (TCO) study.  There were about 25 organizations that participated in the original TCO study from 1999 to 2001.
Since then each year we do several TCO studies.  We try to look at this as part of these engagements.  Based on these casual observations our current estimate of features used for mission-critical applications is 20% often, 30% infrequently and half hardly ever.  I am not sure the numbers are 1,000 organizations or 2,000 applications, but it could be close.  Please let know who you contacted at our organization so I can educate that person. This information is from the top.  Thank you, Jim Johnson, Chairman, The Standish Group.  If you need further information you can e-mail .(JavaScript must be enabled to view this email address)

Mark Ferencik said…

Mike, I have been one of the guilty parties citing these numbers at speaking events. I did read Jim Johnson’s comment below which does support the overall findings trend. I also ran the numbers by Kath Straub at Usability.org and Janey Barnes of User-View (2 notable research companies I have worked a lot with) and they agreed with the overall ranges. I ran usability research at GSK and McKesson for many years including site-wide metrics studies on some major websites and found these numbers to in line (and often quite generous). I find that the take home message is that Agile or Waterfall both can result in a tremendous amount of waste if you are not gathering regular research from end users and are relying too much on non-user stakeholders. Your opinion carries a lot of weight (I’m a big fan of your book) so I was wondering if Jim Johnson’s comment below would give you any reason to adjust the blog posting above? Thank you.

ddelpercio said…